

Strategos
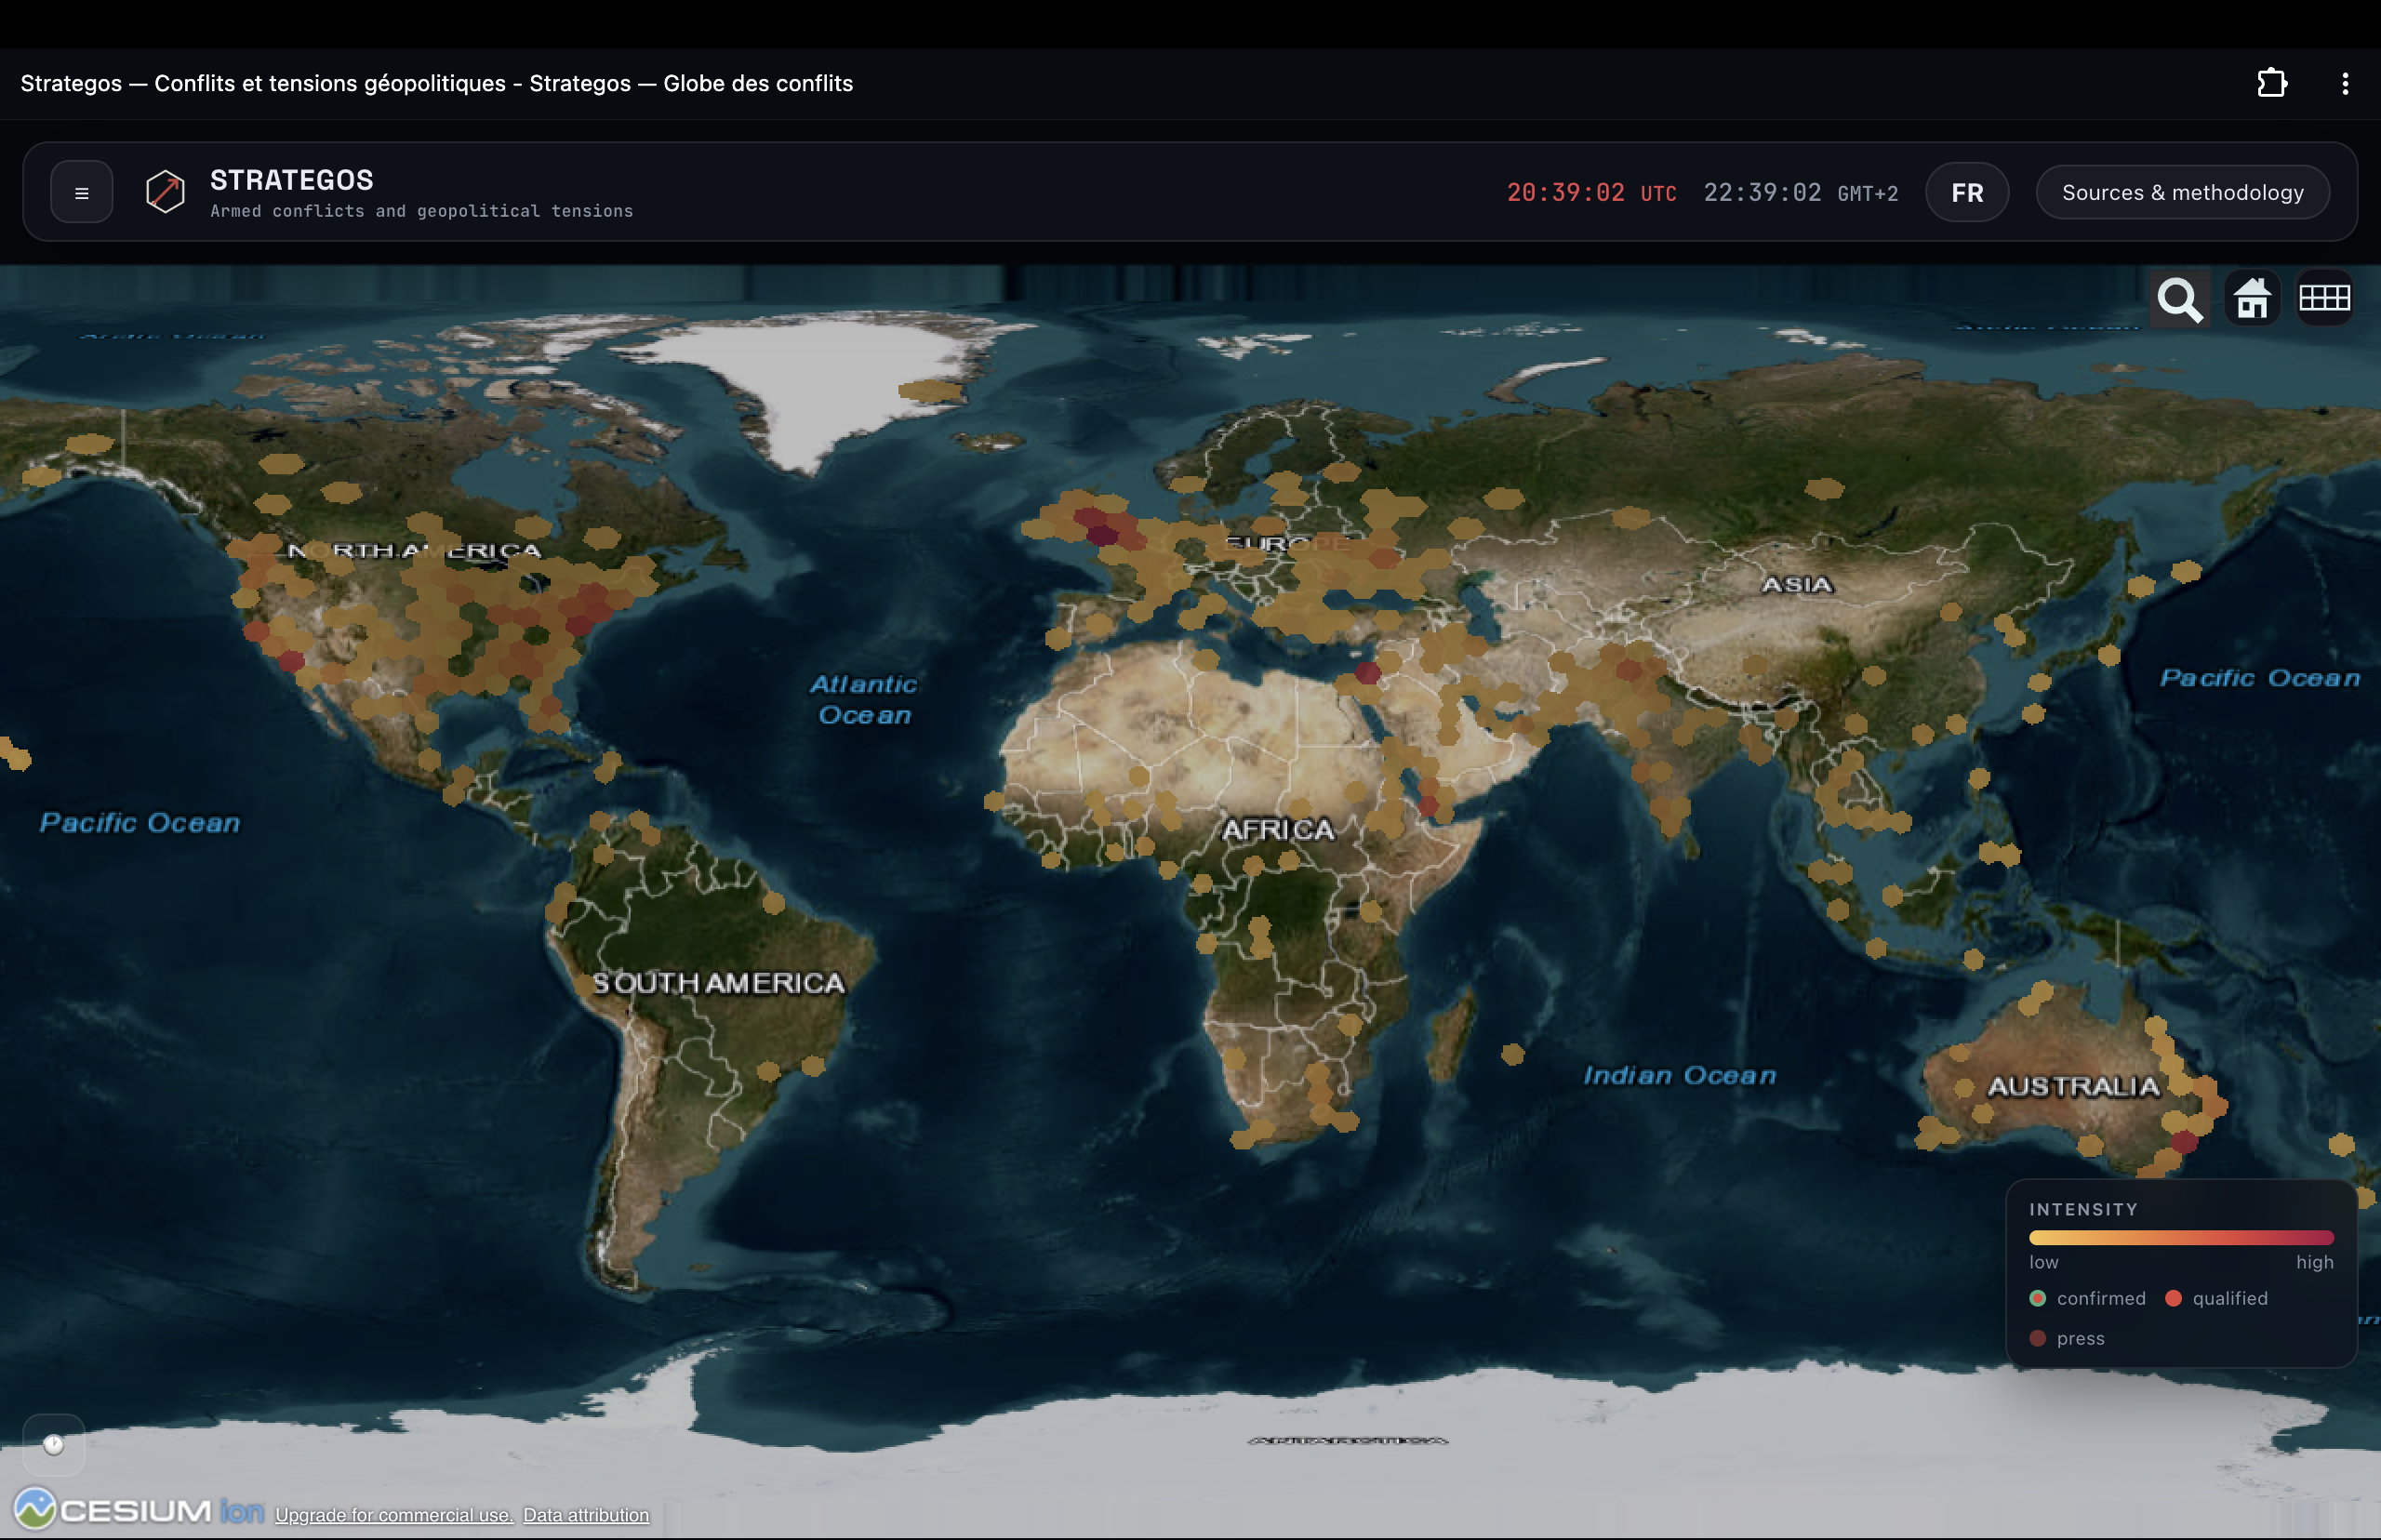
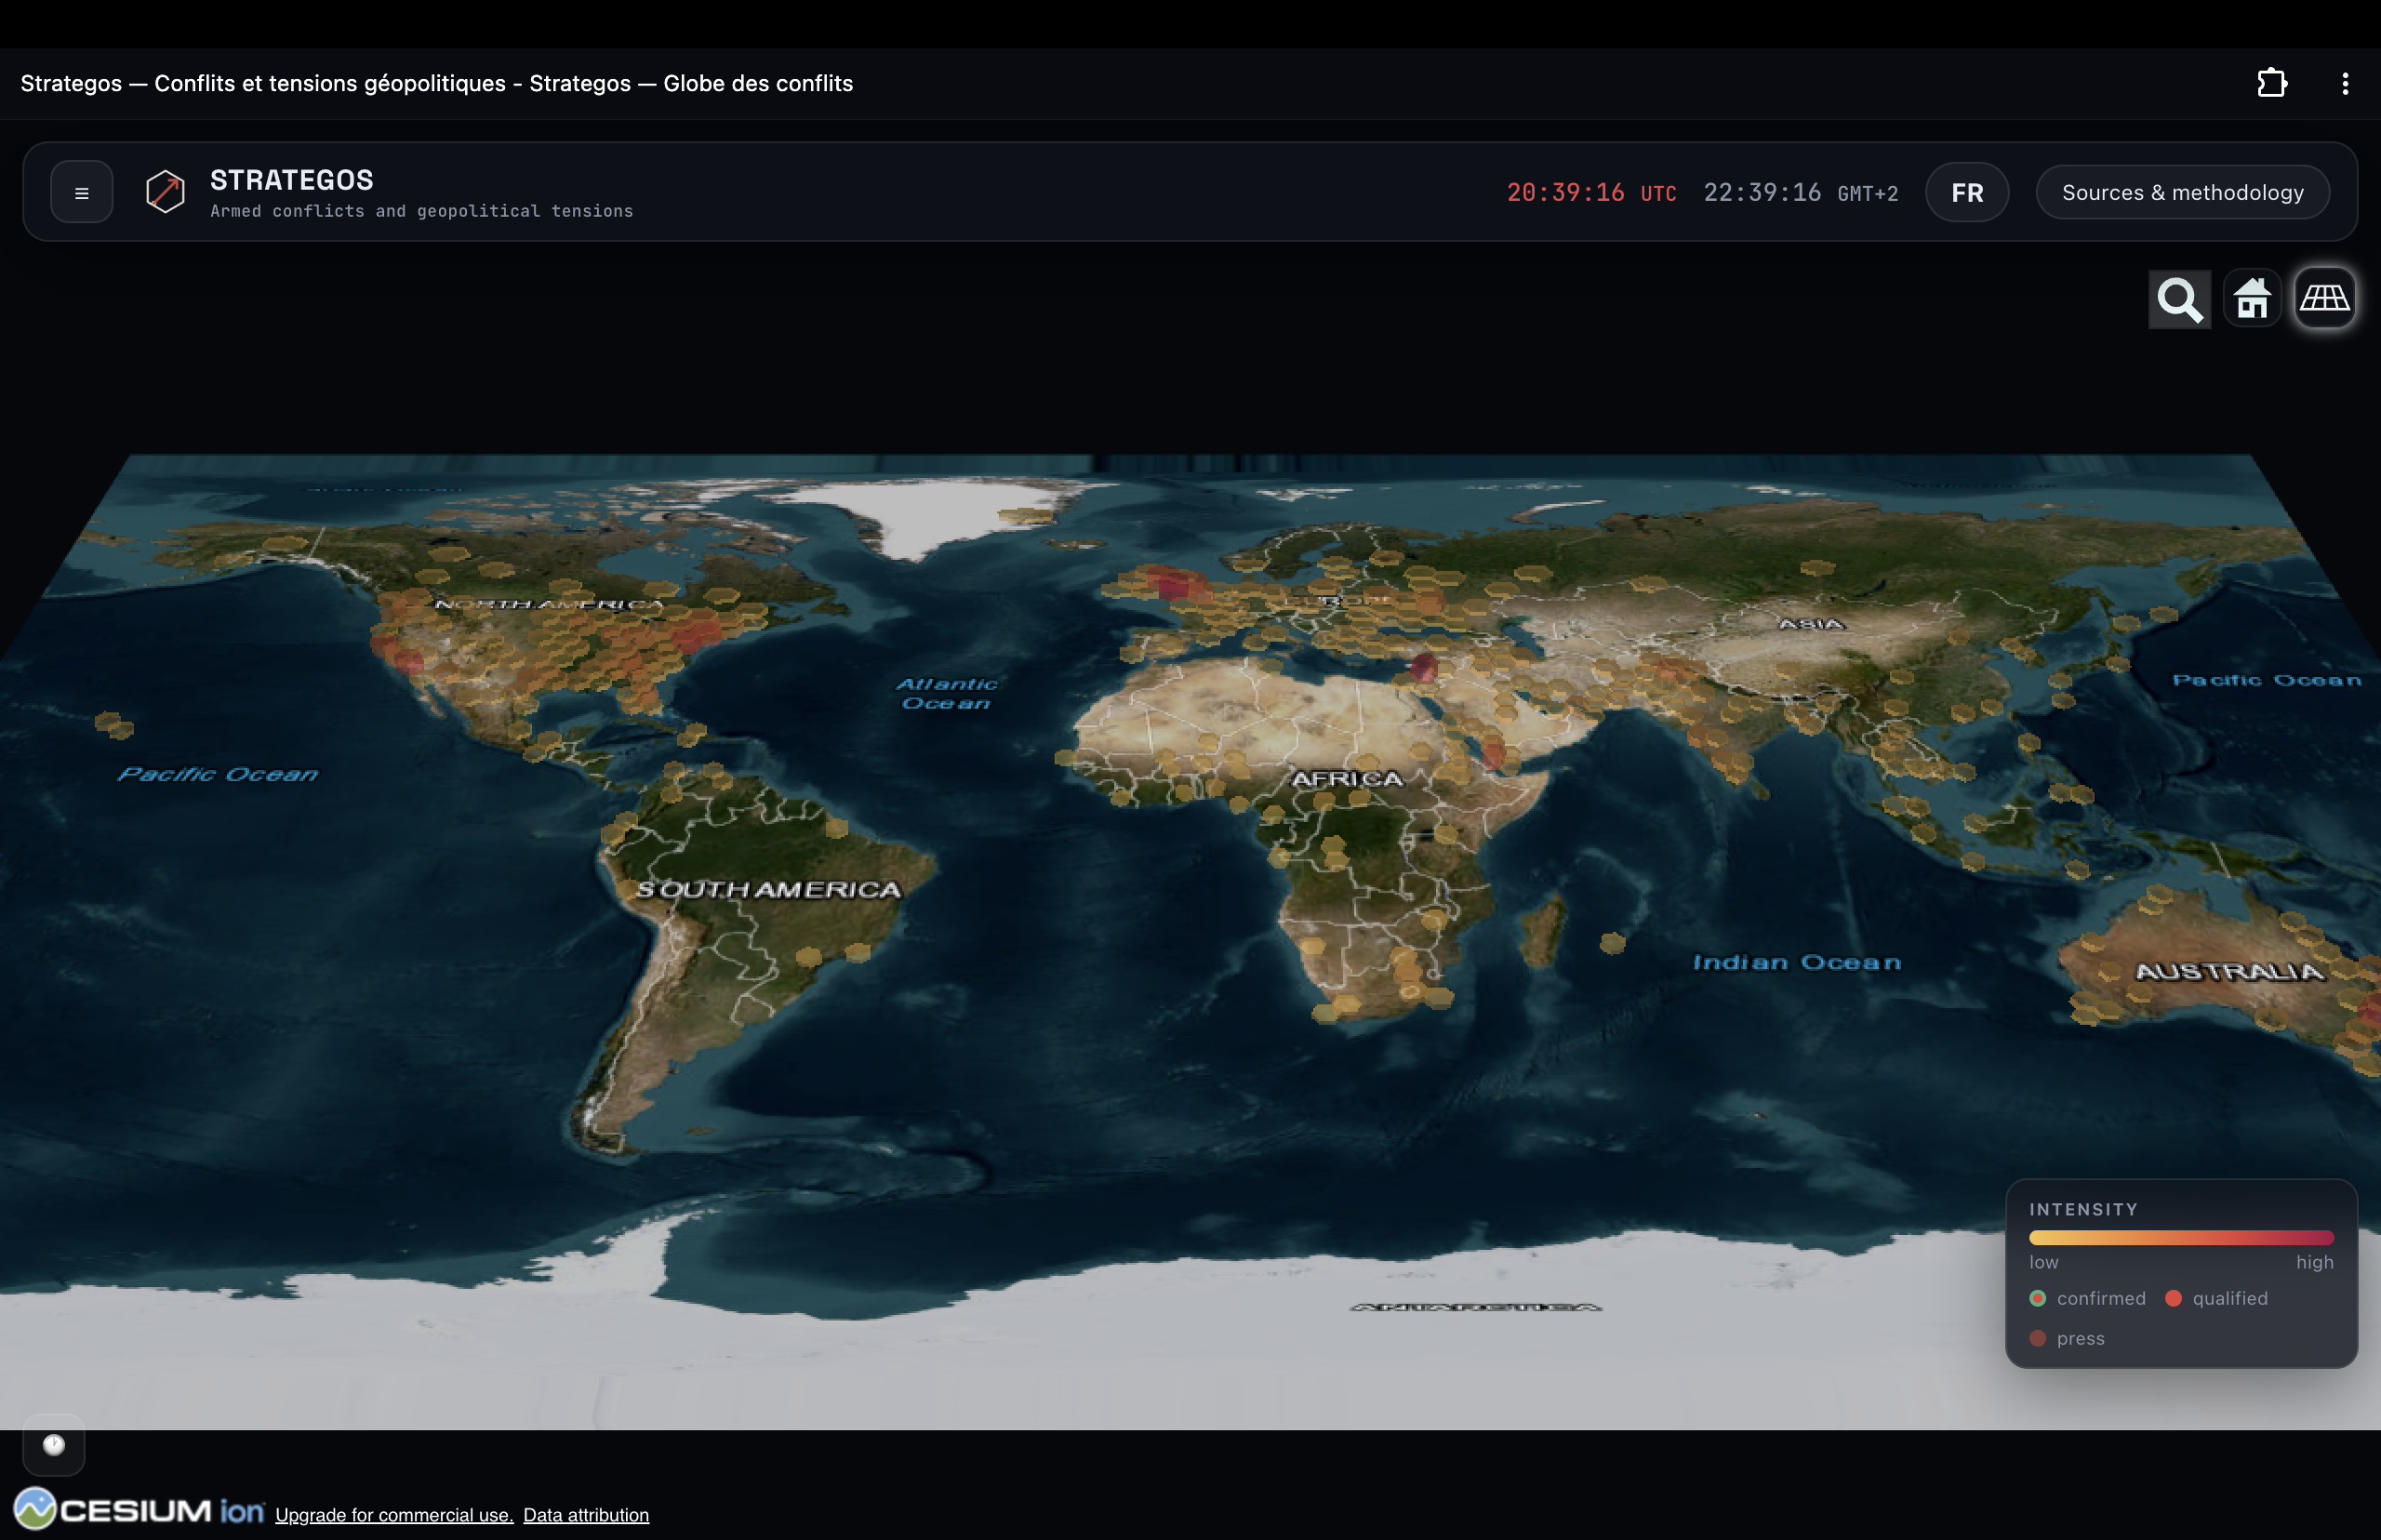
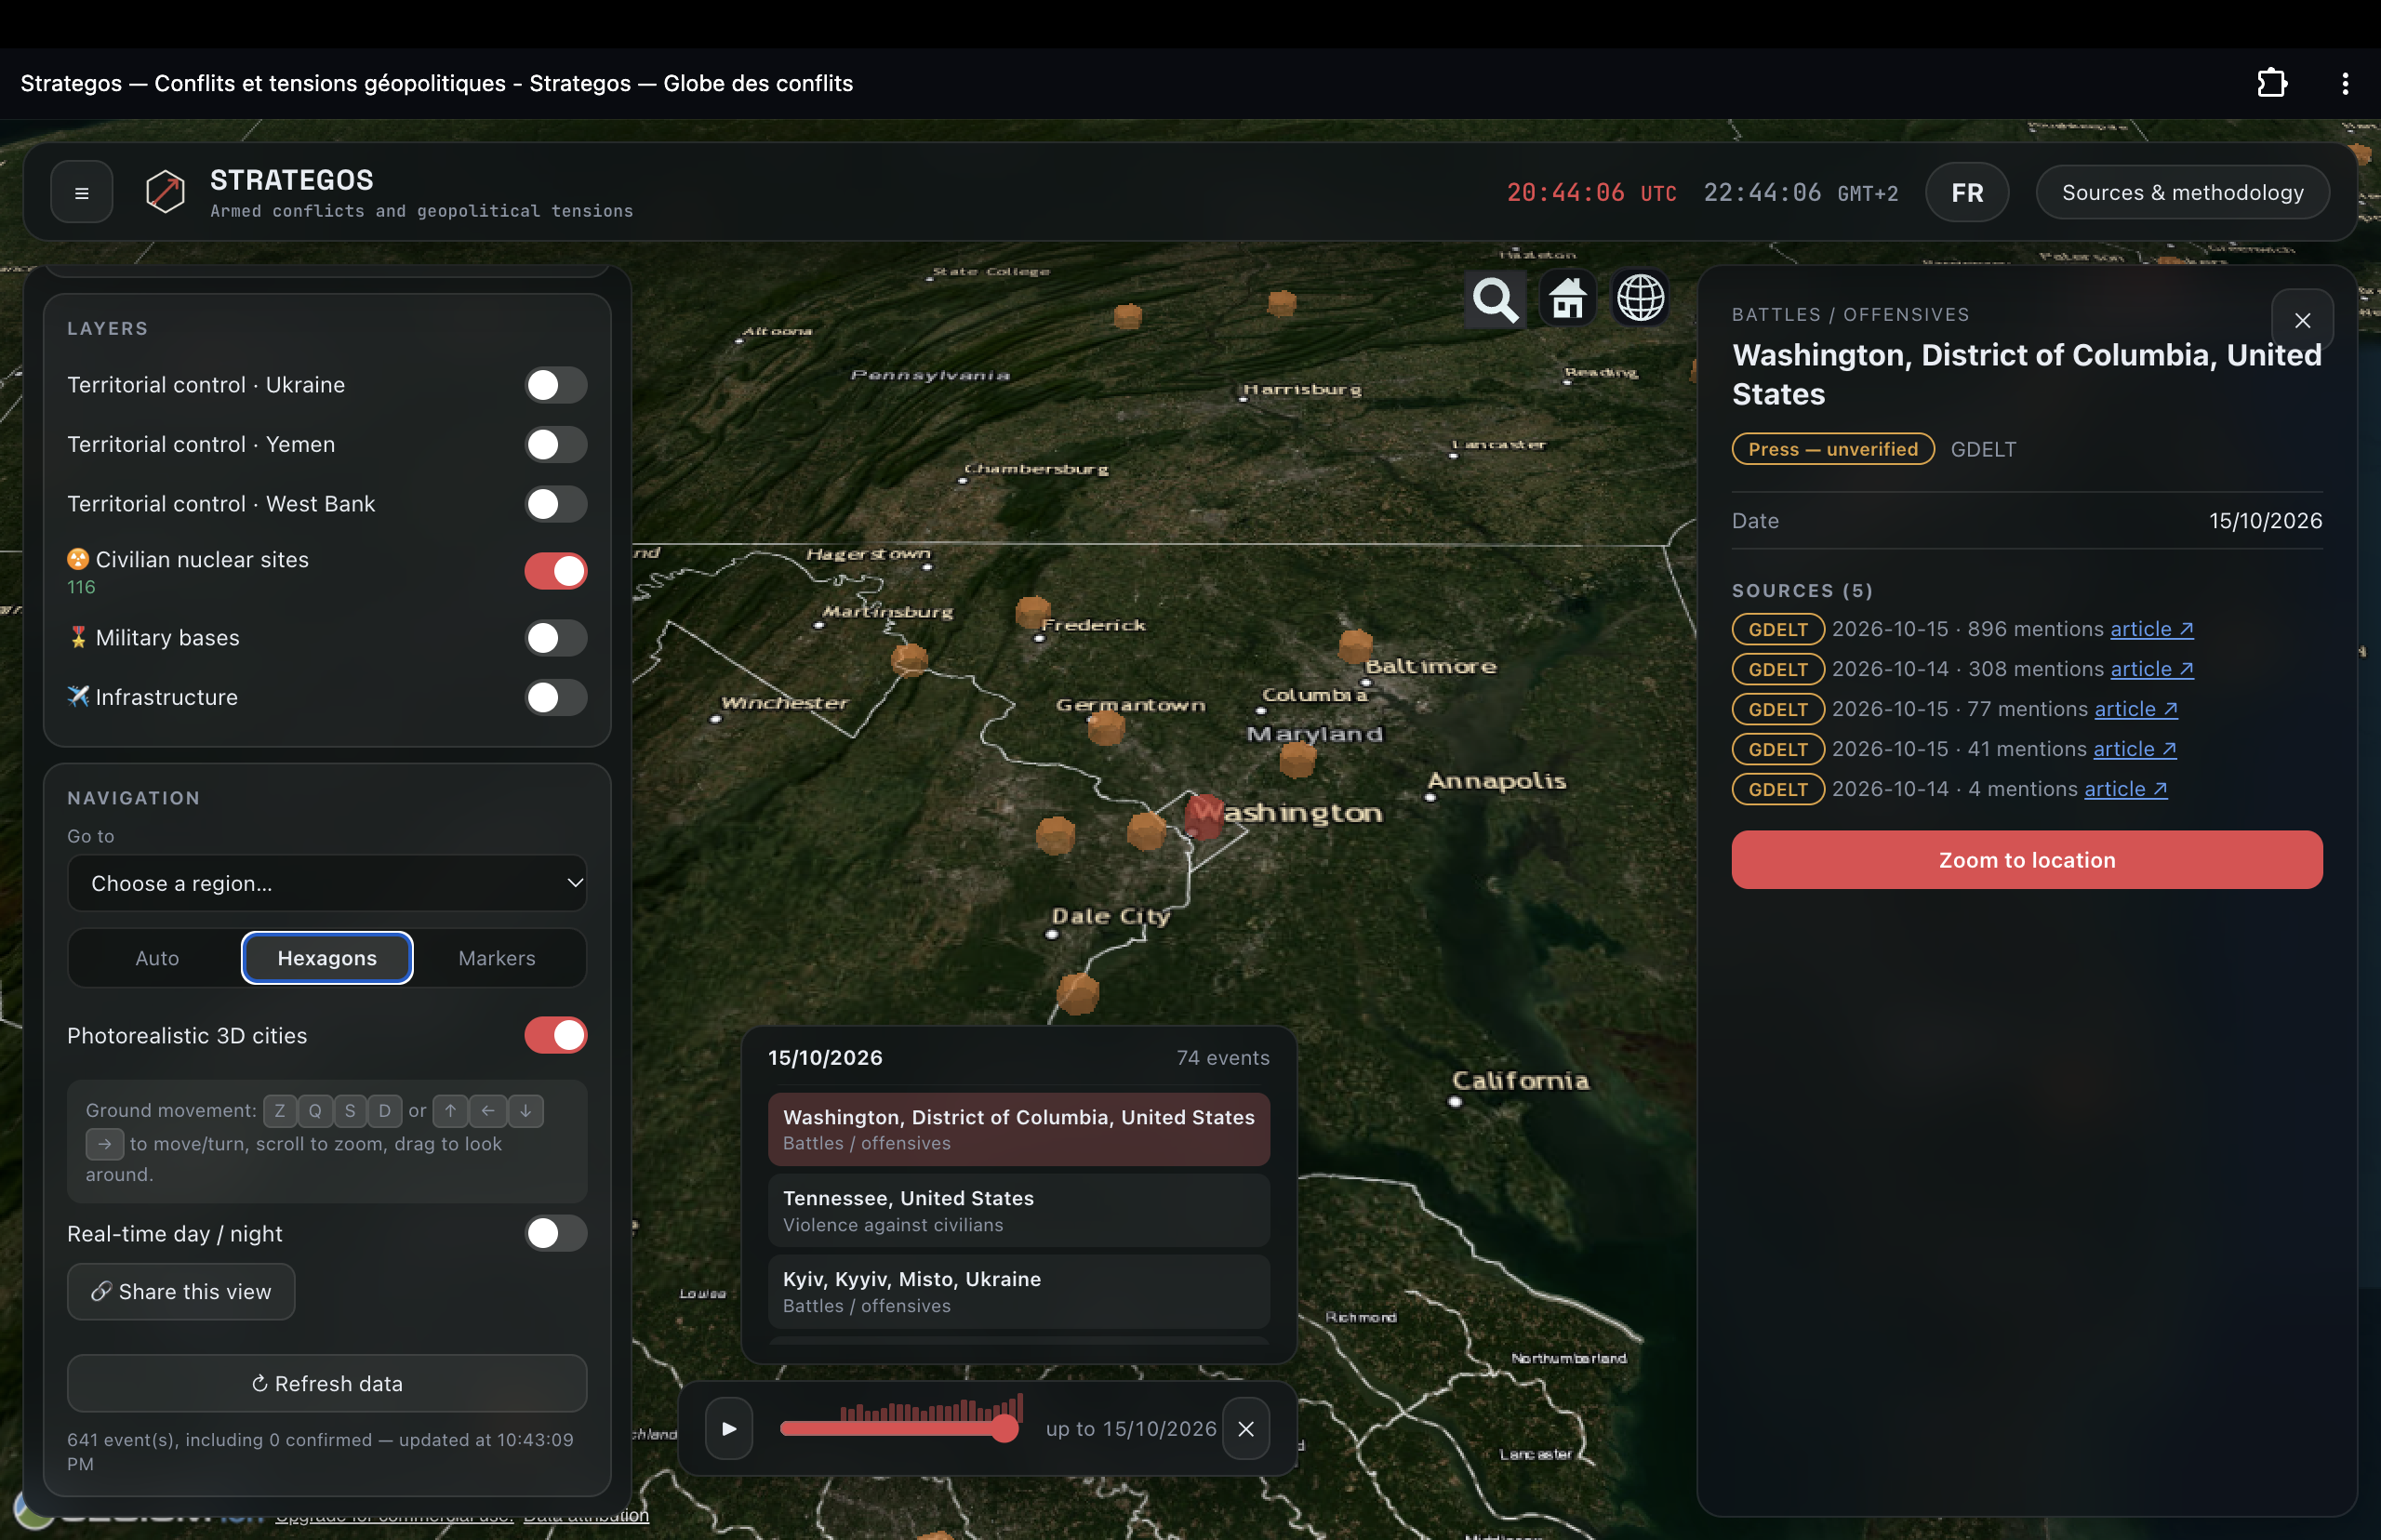
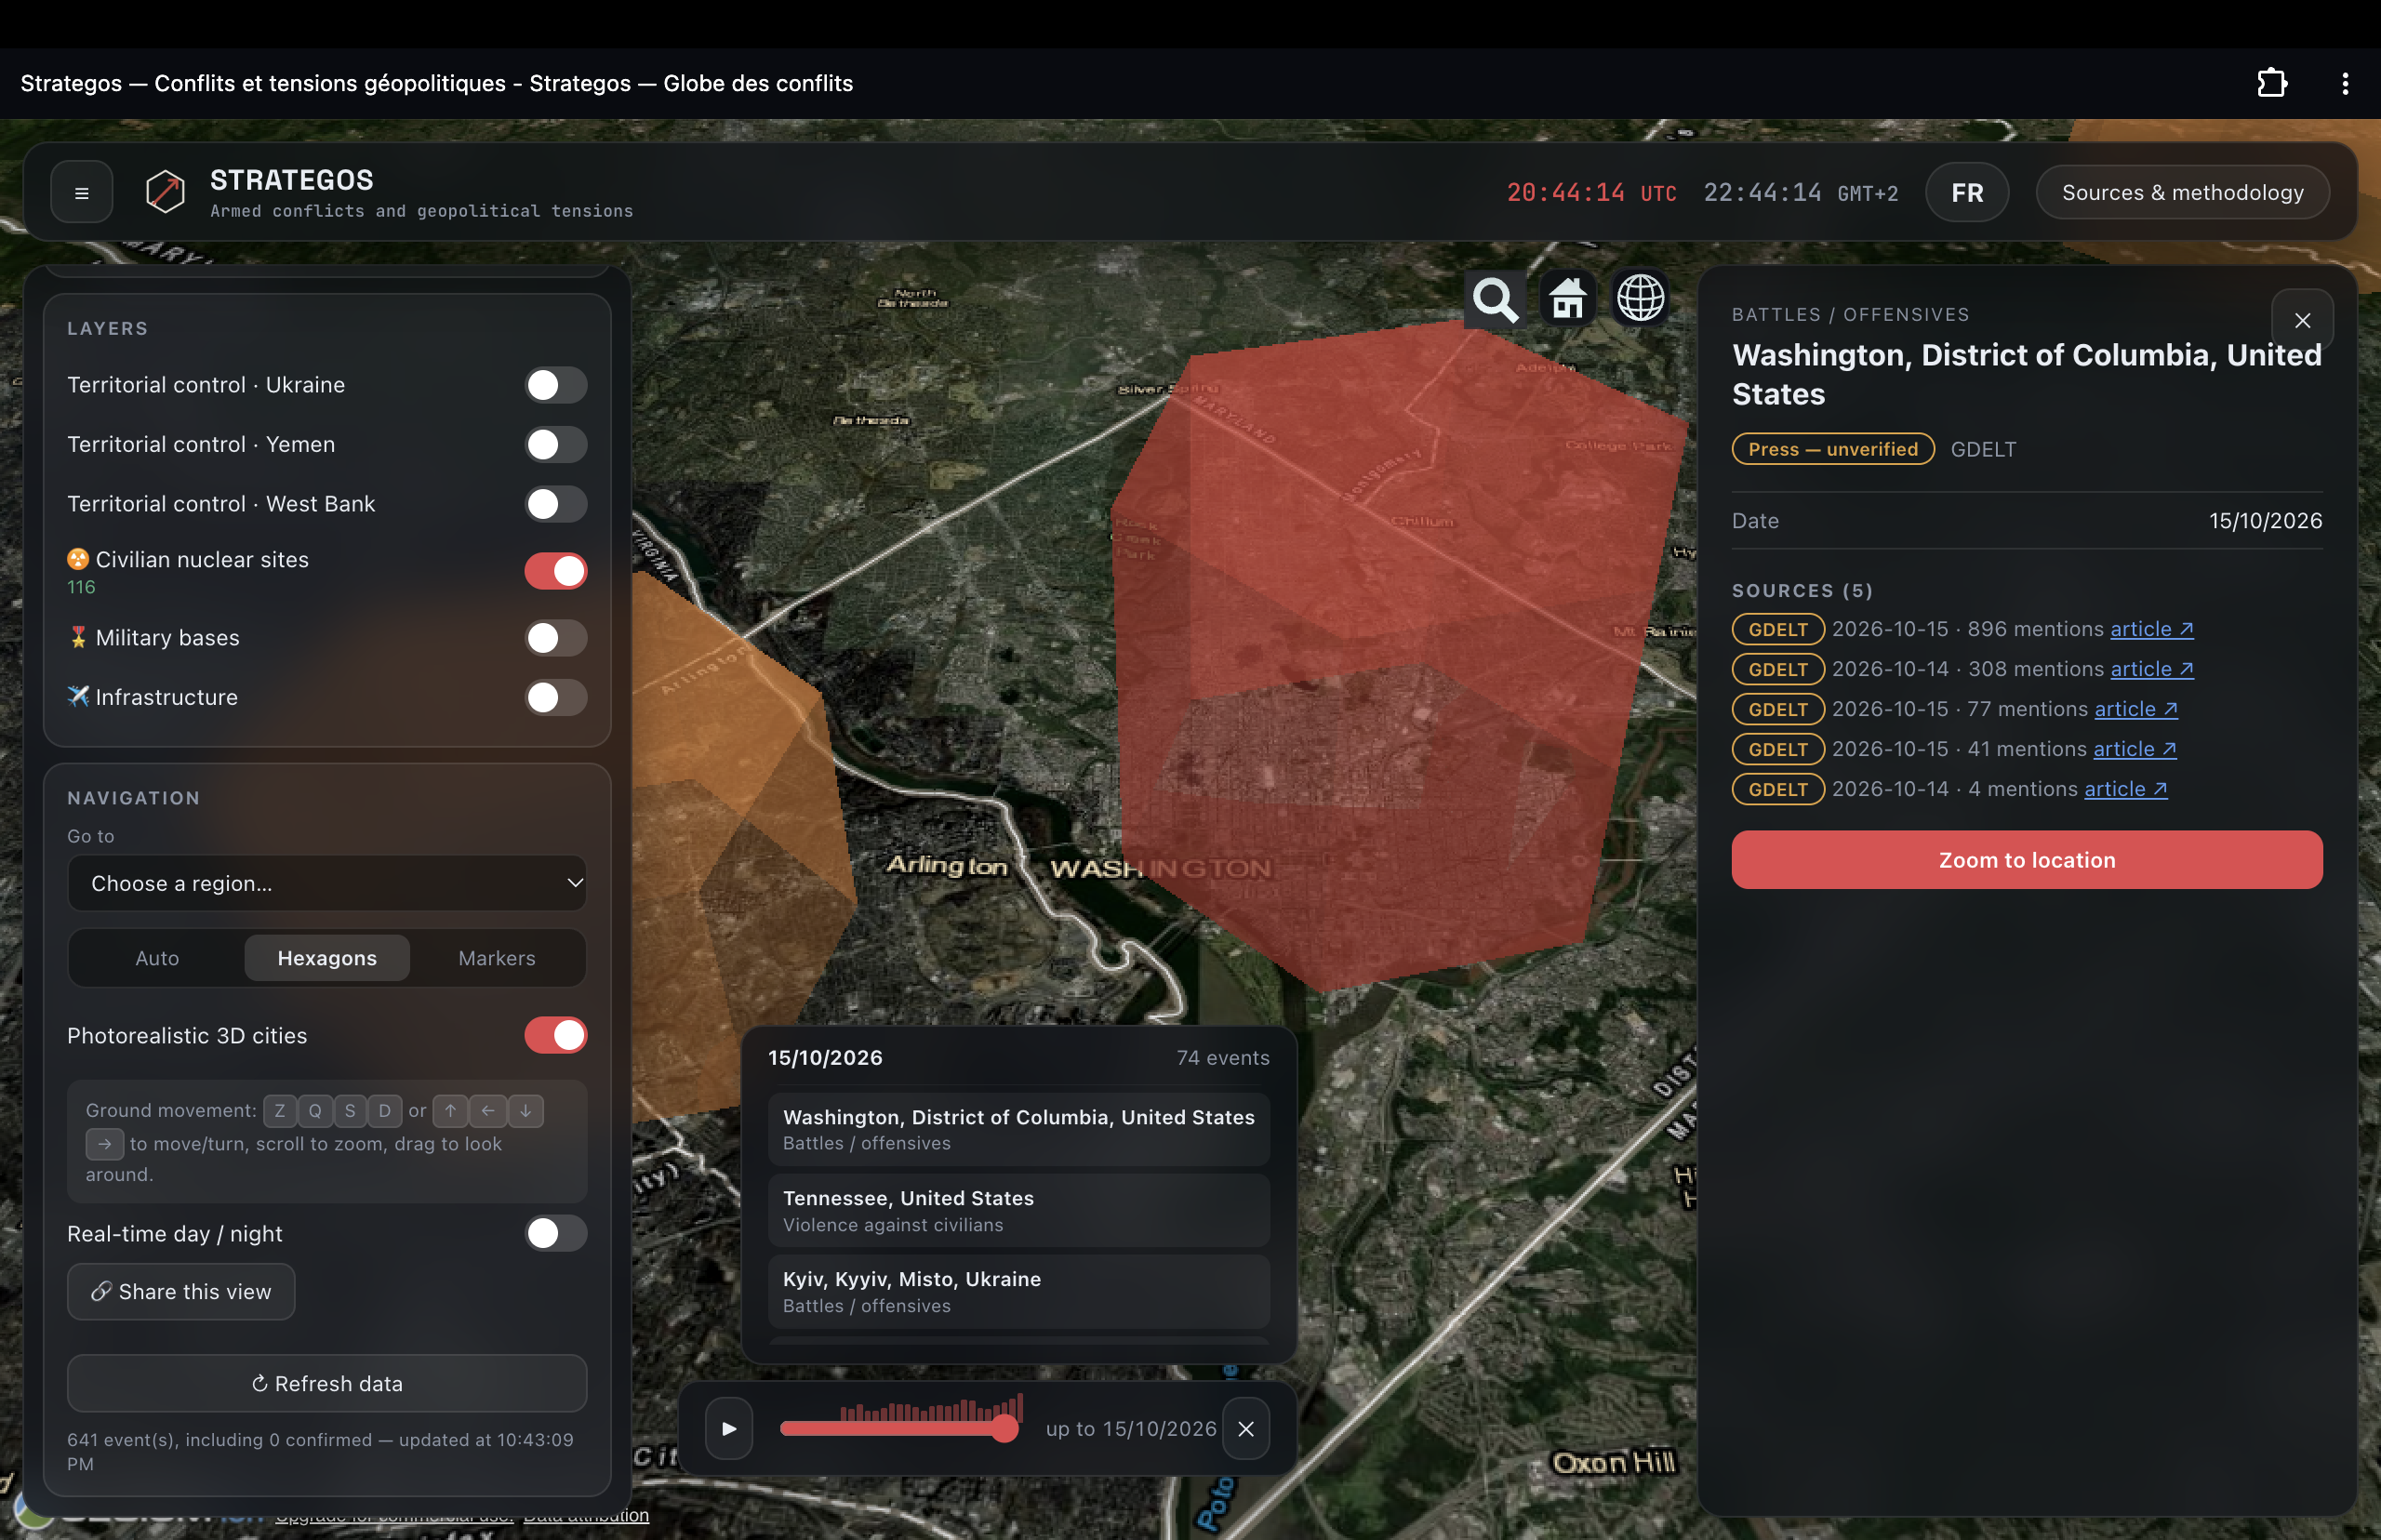
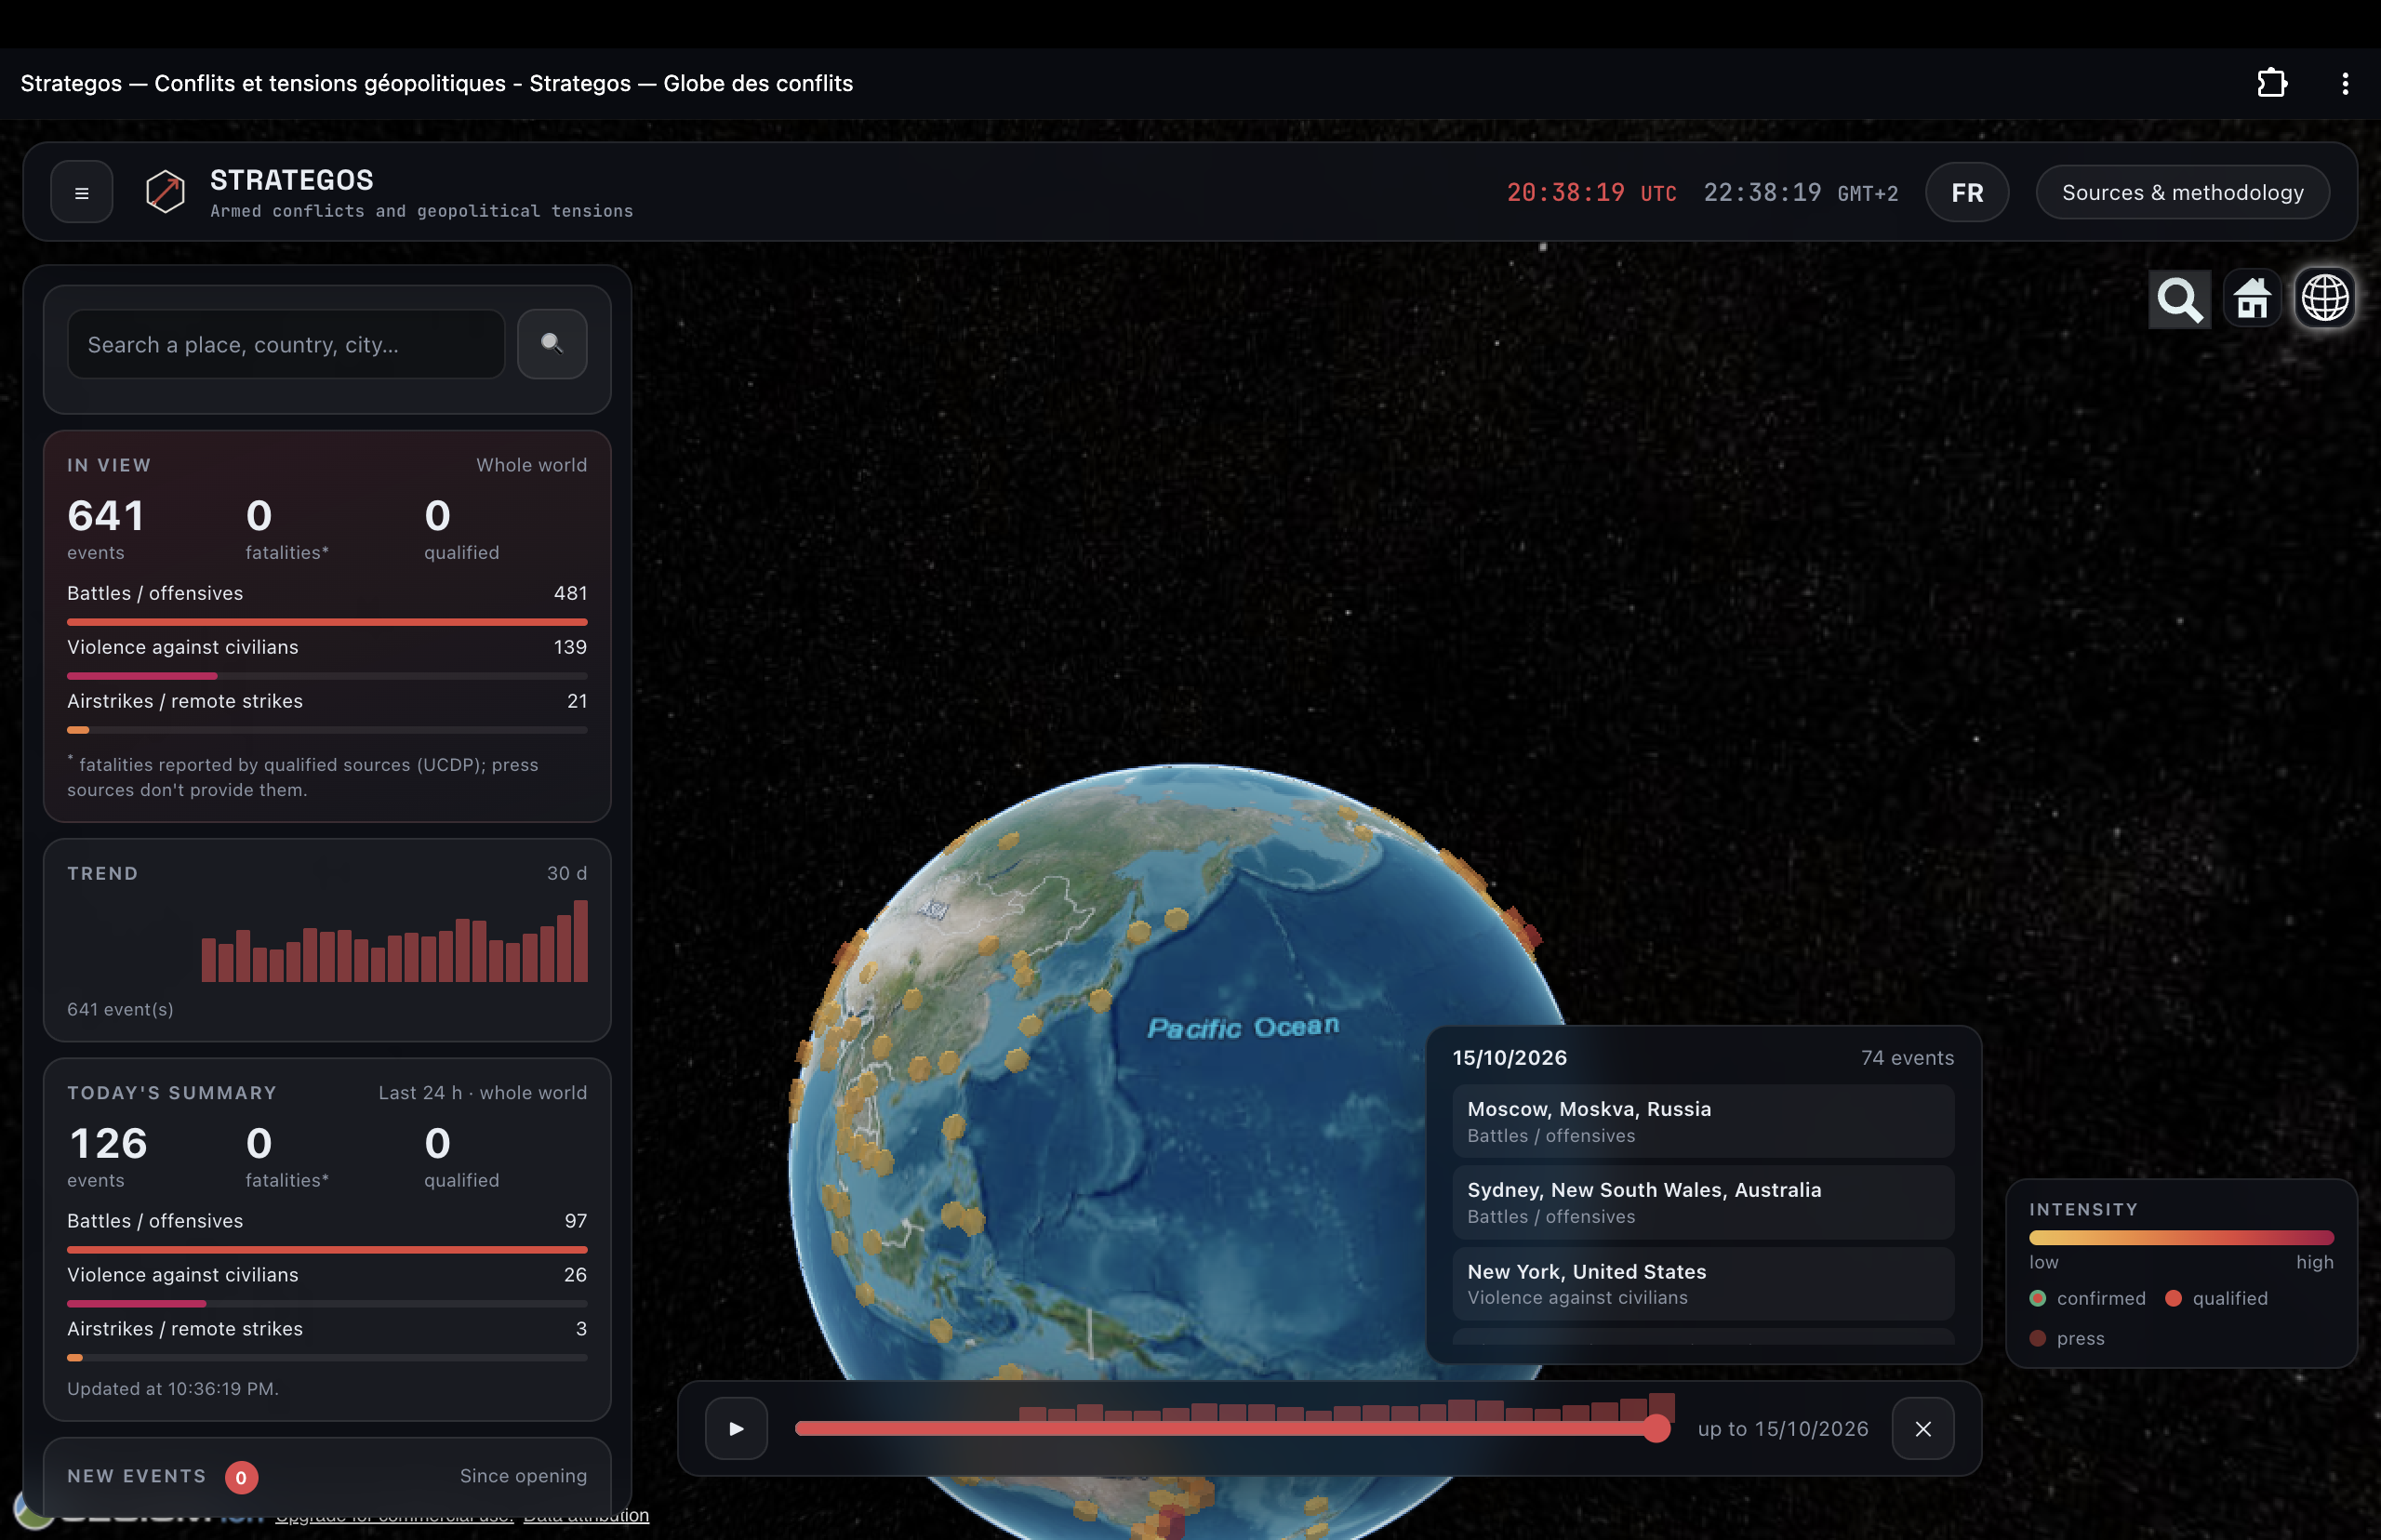
Strategos is an interactive 3D globe for exploring armed conflicts and geopolitical tensions using real open data. It combines multiple independent sources, displays source and confidence information, and includes a time-based view, territorial-control layers and contextual infrastructure.
Project details
Objective
The goal was to build a clear, interactive way to explore conflict events and geopolitical context on a 3D globe, while making data sources, freshness, confidence and limitations visible to users.
Technologies used
The globe and map layers use CesiumJS, with a TypeScript Cloudflare Worker handling API routes, scheduled collection and generated methodology pages. Cloudflare KV caches source data; GeoJSON layers and static assets are served by the Worker. The project combines independent sources including UCDP and GDELT, with contextual layers from Wikidata and OpenStreetMap. Optional Cesium Ion services enable terrain and photorealistic 3D cities.
Challenges and solutions
The main challenge is that open sources differ in coverage, update frequency and reliability. Strategos keeps source failures independent, shows data freshness and attribution, and distinguishes confirmed, qualified and press-only reports rather than presenting every event as equally verified. Territorial-control layers are explicitly identified as estimates with their own source and limitations.
Gallery